The ForNAV Report Pack 7.0 contains a set of out-of-the-box Excel reports to enable exporting aggregated data from the Business Central Ledger tables.

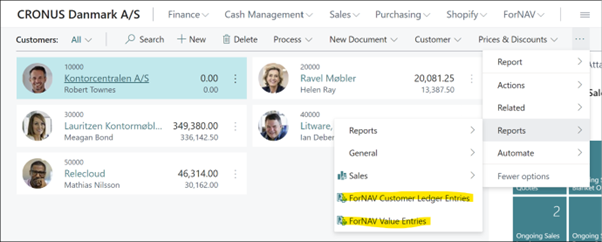
Each report can be run from their respective parent page (Customer List, Vendor List, and so on).
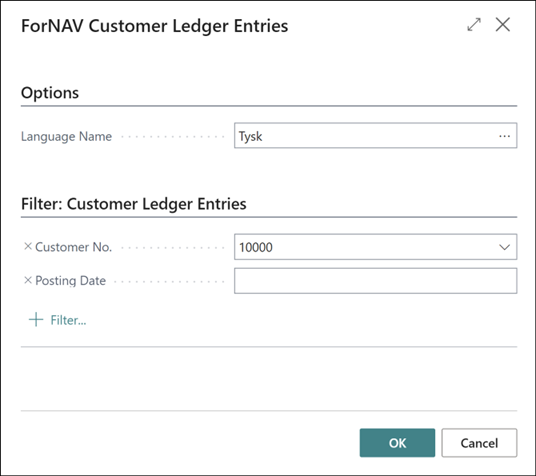
On the request page, you can select the language of the Excel sheet and you can set filters on dimension, posting date, and the root table to limit the number of rows in the dataset.
All reports are built on top of the Query object, enabling fast aggregation of data per month by dimension, where all column and worksheet captions are translated into the language selected on the request page.

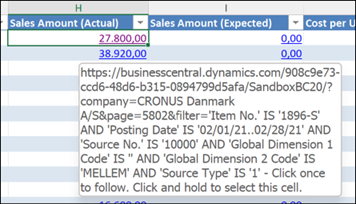
All decimal numbers have hyperlinks back into Business Central, showing the details behind the number.
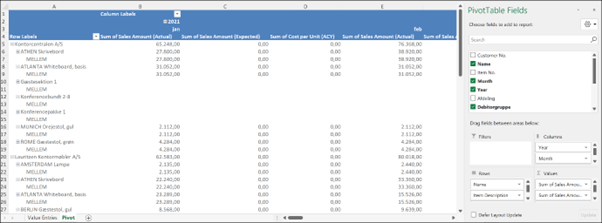
The reports also come with a standard Pivot table, which you can easily modify and use in a custom ForNAV report layout.
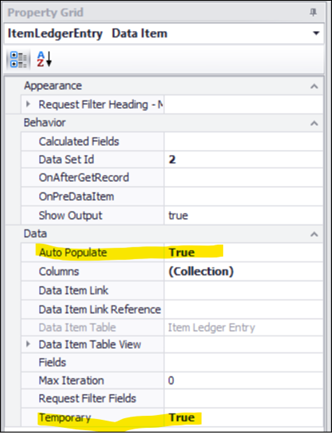
The reports are all built using a set of temporary tables that are populated by a set of Business Central Queries. These temporary tables can also be used in other ForNAV reports. Setting Temporary and Auto populate to True
automatically runs the Query and populates the table with the result, without having to write AL-code.


Pingback: Announcing ForNAV 7.0 - ForNAV